We live in a digital world where any action or reaction can be tracked and boiled down to numbers. The biggest challenge is understanding which numbers to pay attention to.
In 2015, the amount of data produced every two days matched the amount of data produced in all of history prior to 2003.
Although employee advocacy is much larger than just brand awareness and traffic generation, this post will focus specifically on how to measure employee advocacy results from your solution using Google Analytics and other marketing automation tools (we use Pardot in our examples).
The Importance of Measuring Website Traffic & Conversions
Your website is your marketing headquarters. When people search for or discover new products and brands, they visit a website before purchasing. Business cards, coupons, ads, content, SEO, social media, etc., all point back to your website.
For employee advocacy programs, you need to track the significance of your employees driving traffic to your marketing headquarters.
How much of your social media traffic comes from links your employees share?
Your website also hosts different resources, assets, and newsletter signup forms. How many of these forms are filled because of a link your employees shared on social?
The good news is this: if you’re using an employee advocacy software, all of this information can be tracked. But how?
Website Tracking Through UTM Codes
Before getting into how to measure employee advocacy results from your solution, let’s first take a look at how marketing tools usually measure this traffic.
A UTM code is a simple code you add to the end of a custom URL in order to track information on where visitors are coming from. Google Analytics and most automation software use these codes to segment your website traffic into different referral groups.
PostBeyond (our employee advocacy software) adds these codes automatically to any link employees share from the platform. This means that when someone clicks a link on social media from your workforce, Google Analytics automatically knows that it came from a PostBeyond share.
The most used codes are utm_campaign, utm_medium, and utm_source.
- utm_campaign is your campaign name. In our case, we use utm_campaign=PostBeyond.
- utm_medium is the marketing medium. This could be CPC, email, banner ads, etc. In our case, we use utm_medium=social.
- utm_source is the referrer. It could be Google, HubSpot, Twitter, newsletter, etc. In our case, we use utm_source=Twitter, utm_source=LinkedIn, and utm_source=Facebook depending on where the update was shared.
As you can see, anyone that clicks on the link will immediately be segmented properly based on where the traffic comes from. Now let’s dig deeper into how to find this data.
Setting Up Tracking In Pardot
Let’s first start with setting up UTM tracking in your marketing automation software. In this example, we use Pardot. But it’s done similarly with other software providers.
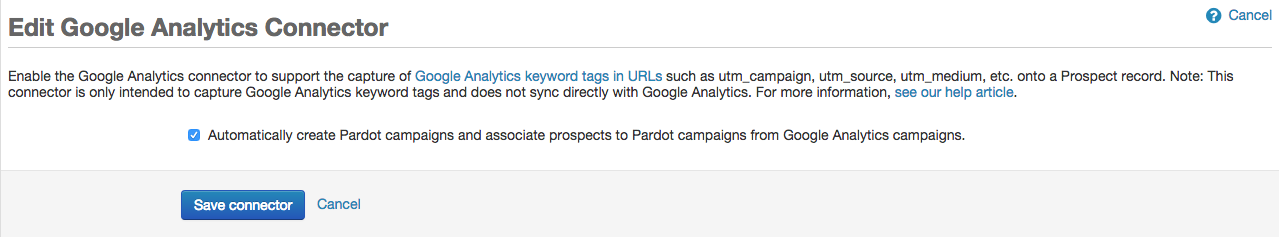
When you log in as an admin user into Pardot, go to Admin>Connectors. Click the +Add Connector button. There will be an option for Google Analytics. Select this option.
There will be a checkbox saying “Automatically create Pardot campaigns and associate prospects to Pardot campaigns from Google Analytics campaigns.” Make sure this is checked.

This will create a campaign in Pardot that’s called PostBeyond. Any first-time visitors that come from a link your employees share will automatically be added to this campaign.
When you click a prospect’s profile, you’re able to see that they belong to the PostBeyond campaign, and view any matching activities that happened since they first appeared in the campaign.
When you go into your campaign reports, you can see an overview of how the traffic from PostBeyond is performing.
One of the great things about Pardot (and other marketing automation tools) is that they sync directly with Salesforce. So you can view prospect activity within your CRM, and pull reports to see how much revenue it brought over time.
Accessing Campaign Data in Google Analytics
Now let’s take a look at how to segment your traffic in Google Analytics.
In the navigation, go to Acquisition>Campaigns>All Campaigns. Here you’ll have access to every campaign that has sent traffic to your website. Find your employee advocacy campaign (i.e. PostBeyond), and click it.
Once you click the PostBeyond campaign, you’ll see basic information about the campaign:
- First, your traffic is segmented by source, so you know which social network is most effective in your employee advocacy program.
- Second, you’ll see acquisition data, meaning the amount of traffic and users.
- Third, you’ll have access to behavioural information, like whether or not visitors saw multiple pages, or left after viewing the first page.
- And last, you get conversion data.
*Note: In this view, your conversions are only calculated based on the last touchpoint, meaning that someone needs to complete a goal on the same visit as the link click. If they come back over time to complete a goal, this will not get captured in this view. It is a limitation of Google Analytics, which is why we strongly recommend you supplement tracking with a marketing automation software.
To find out more about how to set up conversion goals, check this out.
Now let’s dig a bit deeper.
To find out which user generated the most traffic, change the primary dimension to Other>Acquisition>Keyword. This will give you a 4-digit code that corresponds to the user code within PostBeyond.
You can segment user data even further by adding a secondary dimension.
Users by source [Secondary dimension>Acquisition>Source]
Users by Page Title [Secondary dimension>Behaviour>Page Title]
You can create any combination that Google Analytics makes available. Try searching for:
- Users by Age Group
- Users by Region
- Users by Language
- Users by Gender
Now let’s get into some of the more complex stuff.
Multi-touch Funnel Attribution
Since Google Analytics only calculates direct conversion paths, you might be wondering if your employee advocacy program plays a bigger role somewhere else in the conversion goal or not.
Although there’s no way to get individual user data in Google Analytics, you can still get a multi-touch funnel by campaign name.
Go to Conversion>Multi-Channel Funnels>Top Conversion Paths. Adjust your date range and conversion goals. Change “Path Length” to “All,” and “Lookback Window” to 90 days.
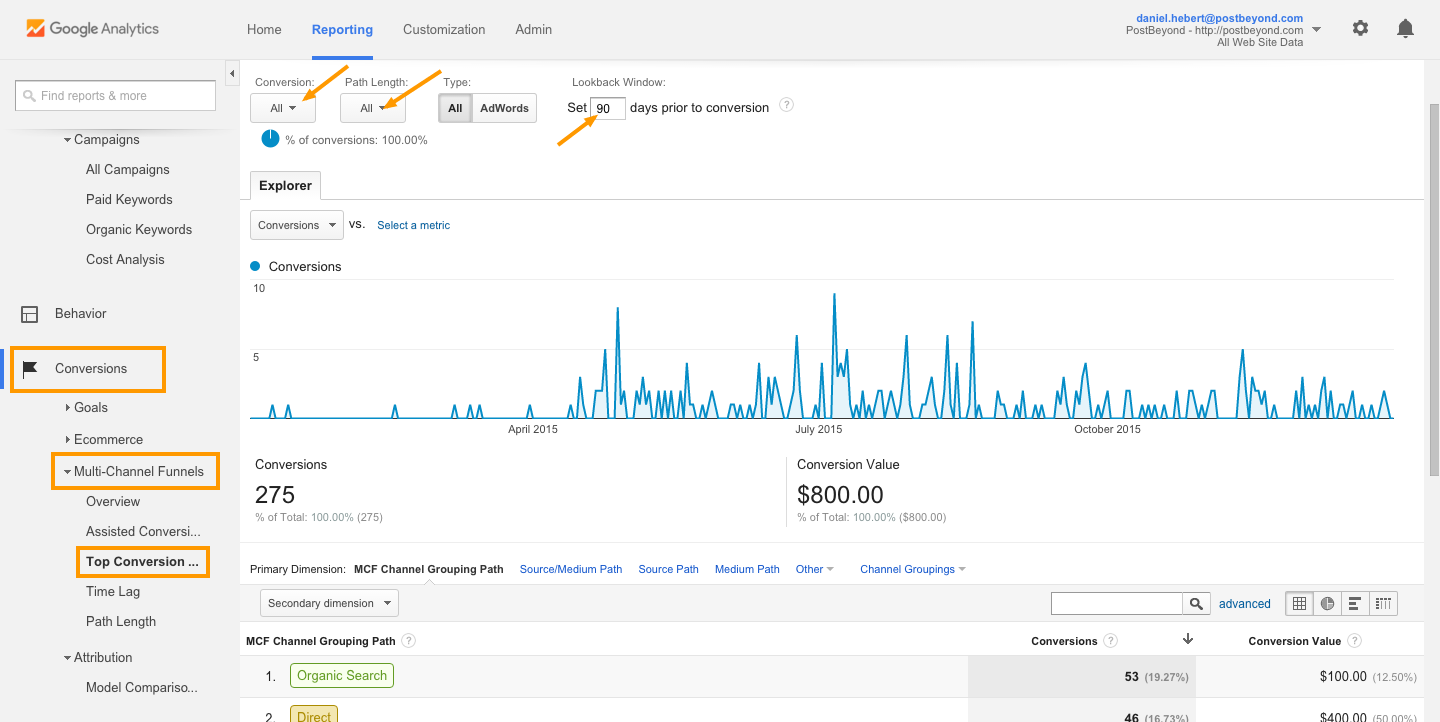
Then, on top of the table, change primary dimension to Others>Acquisitions>Campaign (or Source/Medium) Path. Then, in the search bar, search for PostBeyond (or any other campaign name you might choose).
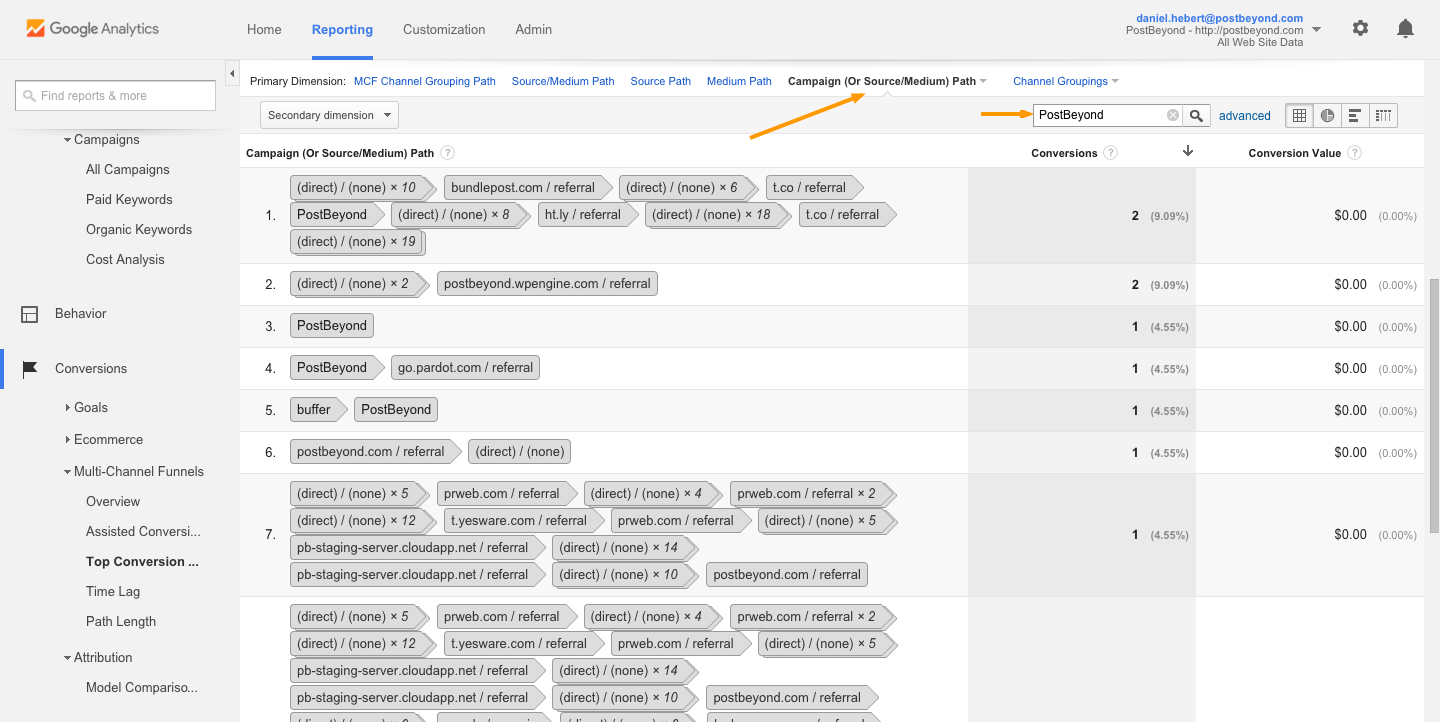
This will show you any conversion path that included a referral from your employee advocacy program within the last 90 days from conversion.
Annotating Google Analytics Data
Although this isn’t meant to track campaign data, annotations are a really powerful tool within Google Analytics.
Google Analytics allows you to add notes to your traffic data by date.
Under Audience>Overview, right below the main graph, you’ll find a drop-down arrow. When you click this, the annotations expand. To add a new annotation, click +Create new annotation. Then, select the date, and add a note.
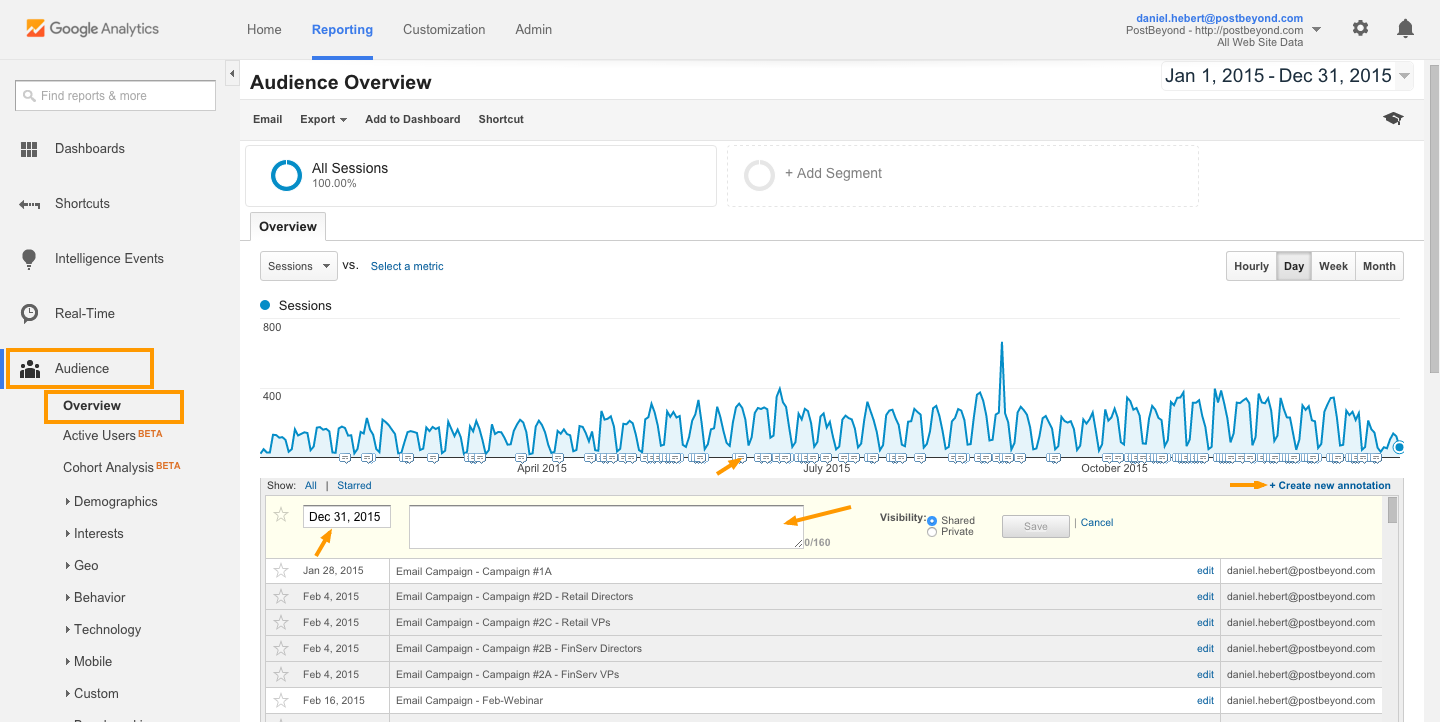
This becomes very useful when you’re reflecting back on traffic behaviour. Here are some of the annotations you could add for your employee advocacy program:
- Start and end date for a leaderboard contest
- Start and end date for a small employee advocacy campaign
- Onboarding new employee group to the software
- Onboarding new department to the software
- Onboarding new region/country to the software
When you look back on these initiatives, you can choose the annotated date and review the impact on traffic, behaviour, and conversions from that activity.
Traffic Is Only Part of It
Remember that employee advocacy programs can provide much more than traffic generation and conversions. It’s important that you track all the metrics that lead to your strategic goals.
How do you measure employee advocacy results at your organization? How do you attribute conversions to your employee advocacy program? Please leave a comment below and share with your colleagues.